
Measuring change
There are many methods of identifying change in treatment according to different measures. Some proprietary measurement systems use algorithms based on very large normative data samples. Others use what is known as 'reliable change indices'. More consider 'moving to recovery' rates. They all have their strengths and their weaknesses and limitations.
Being pragmatic
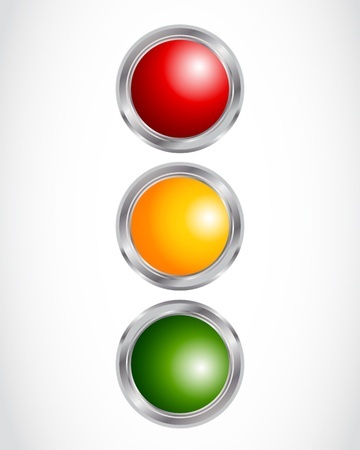
Because we have many different measures available, all of which have their own characteristics, we've decided to use a very simple traffic light system based on the percentage reduction in distress from where one starts. We feel this provides a simple, useful clinical guide to whether a client is moving in the right direction or not, by a lot (green), a bit (amber) or hardly at all, or worse still deteriorating (red).
For a more complete explanation of how the calculations work click here.
For an understanding of the effect of treatment and how it's measured please click here.
What each colour means
On any particular measure, a green signal indicates that there has been a greater than 25% change in reduction of distress from the initial score. An amber signal indicates a between 6% and 25% change and a red signal indicates a change of 5% or less, or, indeed, deterioration. In spite of the fact that our system is basic and very simple we wanted to make sure that the calculations on any instrument were based on movement in the same direction. As MOST measures reduce score with improvement we adopted the strategy of always measuring REDUCTION in distress to create consistency.
Measures where a reduction in score signals improvement
Lets take an example. GAD-7 measures anxiety. It has a maximum score of 21 (maximum anxiety) and a minimum score of 0 (no anxiety). A client attends with an initial score of 16. By the 3rd appointment the GAD-7 score is now 12. There has been a 4 point improvement. 4/16 = 1/4 = 25% (amber signal).
Measures where an increase in score signals improvement
Lets take an example. SWEMWBS measures wellbeing. It has a minimum score of 7 (least wellbeing) and a maximum score of 35 (most wellbeing). A client attends with an initial score of 14. By the 3rd appointment his score is shifted to 21. Because the scores go up with improvement we need to calculate the DIFFERENCE between the scores and the maximum score at each time point. So, the initial score of 14 is subtracted from 35 (35-14 = 21). Then the score at the 3rd session is subtracted from the maximum of 35 (35-21 = 14). The REDUCTION in distress is from 21 to 14. This represents a 7 point improvement. 7/21 = 33.3% (green signal)
Don't focus on the actual percentage value - pay attention to the colour
We do not make any claims about scientific rigour with this basic system. It is what it intended to be, a simple flag of whether a client is moving in the right direction or not on any particular measure. Please don't get hung up on the % numbers. The actual measure scores are right there to look at anyway Remember, your data exports to excel and if you wish to analyse your data according to other criteria you can of course do so.
Pragmatism as opposed to scientific rigour
Measuring change through questionnaires is not the same as measuring body temperature using a thermometer. Scientists argue amongst themselves as to how to calculate effect sizes and as to what constitutes reliable improvement. This can be confusing and frustrating. We've chosen a very simple way of looking at whether change is happening or not. We fully recognise that change characteristics of different instruments vary but we're confident that our approach provides a simple, user-friendly, and, dare we say it, 'pragmatic' clinical tool.
Customised systems can have customised traffic lights
We've adopted this straightforward approach in the single user systems for simplicity. However, for any customers wishing to have traffic light alerts based on different criteria, such as algorithms or reliable change indices, we will build to your specification. Please contact us for more information.